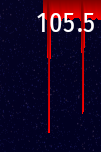
In an attempt to gain more insight into FPS problems, the “show fps” option in v.109+ will also show a red chart. This is what it looks like:

This chart shows the frame duration of the last 30 frames. The most recent frame is on the right, and everything scrolls to the left as time goes by.
The length of each bar is the duration of each frame in ms (if you are playing the game at 1920x1080, then each pixel is 1 ms). The longer the bar, the slower the frame. In the example above, you can see two spikes when the game loaded some assets from disk.
Some undulation is expected and perfectly normal, however the smoother the graph, the smoother your FPS. If you continuously see choppy lines, then try closing unnecessary background applications. If you are running full-screen and you also have V-sync turned on, it’s also possible to see a stair-stepped shape caused by those times when the game can’t achieve the full 60 FPS and unavoidably drops to 30 FPS.